Cash Processing Services
Business Contact
Don Gilman
Managing MemberContact Information
Business Description
Cash Processing Services is located in Sparks, Nevada, and was founded in 2005. At this location, Cash Processing Services employs approximately 15 people. Annual sales for Cash Processing Services are around USD 500,000.
Employees: 15
Revenue: USD 500,000
Founded: 2005
Questions & Answers
Q1
How long has Cash Processing Services been in business?
Cash Processing Services has been in business for around 21 years.Q2
What is the phone number for Cash Processing Services?
The phone number for Cash Processing Services is (775) 343-1424.Q3
How big is Cash Processing Services?
Cash Processing Services generates approximately USD 500,000 in revenue annually, and employs around 15 people at this location.Q4
Where is Cash Processing Services located?
Cash Processing Services is located at 1011 Wild Horse Cyn, Sparks, Nevada, 89434.Q5
What days are Cash Processing Services open?
Cash Processing Services is open Mon–Fri 9 AM–5 PM; closed Sat–Sun.Q6
Is there a primary contact for Cash Processing Services?
Don Gilman (Managing Member) at Cash Processing Services.Q7
What are the annual sales for Cash Processing Services?
Cash Processing Services has annual sales of approximately USD 500,000.Q8
How many people are employeed at Cash Processing Services?
Cash Processing Services has around 15 employees at this location.Businesses in Zip Code 89434
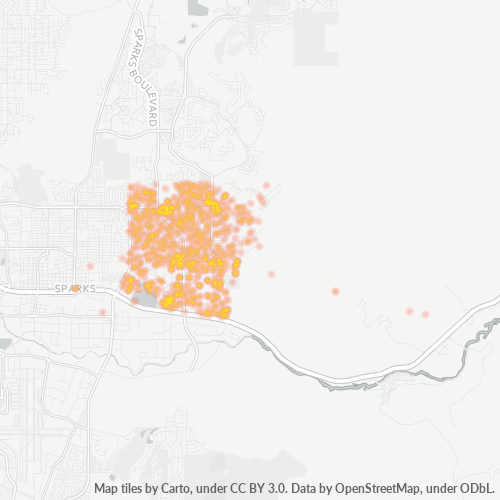
Businesses in 89434: 3,115
Population: 28,776
Categories
Shopping: 22%
Medical: 15%
Other: 63%
Price
Moderate: 56%
Inexpensive: 35%
Expensive: 7%
Very Expensive: 2%
Other: 0%
Area Codes
775: 98%
Other: 2%
Neighborhoods
Copper Canyon: 10%
D'Andrea: 6%
Sparks: 34%
Sparks Business Park: 19%
The Legends at Sparks Marina: 13%
Other: 18%
Stats and Demographics for Zip Code 89434
Race
White: 76%
Hispanic or Latino: 11%
Asian: 6%
Black Or African American: 2%
American Indian Or Alaskan Native: 1%
Native Hawaiian & Other Pacific Islander: 0%
Other: 5%
Gender
Female: 52%
Male: 48%
Other: 0%