Cyborg Users Association
Business Contact
Edye Childs
PrincipalBusiness Description
Cyborg Users Association is located in Chicago, Illinois, and was founded in 2010. At this location, Cyborg Users Association employs approximately 2 people. Annual sales for Cyborg Users Association are around USD 95,000.
Employees: 2
Revenue: USD 95,000
Founded: 2010
Industry
Industry
Industry
Engaged in:
Non-Profit Organization
Non-Profit Organization
ISIC Codes
9499
9499
Questions & Answers
Q1
How long has Cyborg Users Association been in business?
Cyborg Users Association has been in business for around 16 years.Q2
How big is Cyborg Users Association?
Cyborg Users Association generates approximately USD 95,000 in revenue annually, and employs around 2 people at this location.Q3
Where is Cyborg Users Association located?
Cyborg Users Association is located at 118 N Clinton St Ste 301, Chicago, Illinois, 60661-2308.Q4
Is there a primary contact for Cyborg Users Association?
Edye Childs (Principal) at Cyborg Users Association.Q5
What are the annual sales for Cyborg Users Association?
Cyborg Users Association has annual sales of approximately USD 95,000.Q6
How many people are employeed at Cyborg Users Association?
Cyborg Users Association has around 2 employees at this location.Similar Companies Nearby
Additional Businesses at this Address
118 N Clinton St Ste 301 Chicago, Illinois, 60661-2308
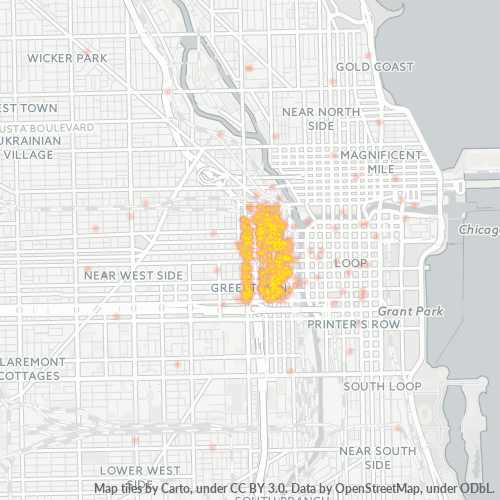
Businesses in Zip Code 60661
Businesses in 60661: 6,345
Population: 4,635
Categories
Professional Services: 36%
Shopping: 12%
Other: 52%
Price
Moderate: 50%
Inexpensive: 35%
Expensive: 10%
Very Expensive: 4%
Other: 0%
Area Codes
312: 91%
Other: 9%
Neighborhoods
Fulton River District: 15%
Near West Side: 70%
West Loop: 6%
Other: 9%
Stats and Demographics for Zip Code 60661
Race
White: 56%
Black Or African American: 21%
Asian: 15%
Hispanic or Latino: 6%
Native Hawaiian & Other Pacific Islander: 0%
Other: 2%
Gender
Male: 54%
Female: 46%
Other: 0%