I.E. Culture, Inc.
Business Contact
Mari Fuentes Jones
Registered AgentContact Information
I.E. Culture, Inc.
27475 YNEZ RD #721, TEMECULA, CA 92591, United States
Temecula, California, 92591
Get Directions
27475 YNEZ RD #721, TEMECULA, CA 92591, United States
Temecula, California, 92591
Get Directions
Edit: Edit or Remove
Business Description
I.E. Culture, Inc. is located in Temecula, California, and was founded in 6/29/07. At this location, I.E. Culture, Inc. employs approximately 2 people. Annual sales for I.E. Culture, Inc. are around USD 55,000.
Employees: 2
Revenue: USD 55,000
Founded: 6/29/07
Filing Number: C2991363
Questions & Answers
Q1
How long has I.E. Culture, Inc. been in business?
I.E. Culture, Inc. has been in business for around 19 years.Q2
How big is I.E. Culture, Inc.?
I.E. Culture, Inc. generates approximately USD 55,000 in revenue annually, and employs around 2 people at this location.Q3
Where is I.E. Culture, Inc. located?
I.E. Culture, Inc. is located at 27475 YNEZ RD #721, TEMECULA, CA 92591, United States, Temecula, California.Q4
Is there a primary contact for I.E. Culture, Inc.?
Mari Fuentes Jones (Registered Agent) at I.E. Culture, Inc..Q5
What are the annual sales for I.E. Culture, Inc.?
I.E. Culture, Inc. has annual sales of approximately USD 55,000.Q6
How many people are employeed at I.E. Culture, Inc.?
I.E. Culture, Inc. has around 2 employees at this location.Additional Businesses at this Address
27475 YNEZ RD #721, TEMECULA, CA 92591, United States Temecula, California, 92591
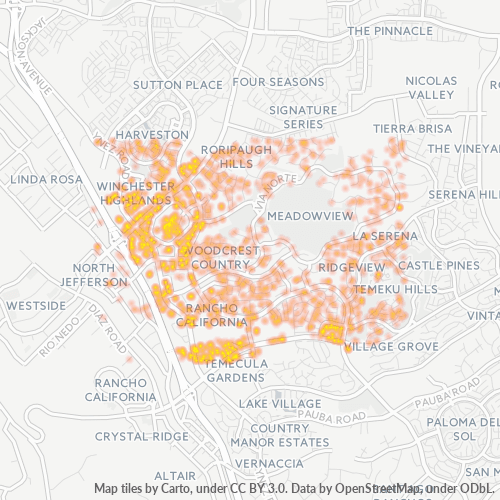
Businesses in Zip Code 92591
Businesses in 92591: 8,814
Population: 44,907
Categories
Shopping: 21%
Medical: 11%
Professional Services: 11%
Restaurants: 10%
Other: 47%
Price
Moderate: 54%
Inexpensive: 37%
Expensive: 8%
Very Expensive: 2%
Other: 0%
Area Codes
951: 92%
Other: 8%
Neighborhoods
Harveston: 5%
Margarita Village - Temeku Hills: 12%
Roripaugh Hills: 8%
Temecula: 18%
The Promenade in Temecula: 42%
Other: 14%
Stats and Demographics for Zip Code 92591
Race
White: 70%
Hispanic or Latino: 16%
Asian: 4%
Black Or African American: 2%
American Indian Or Alaskan Native: 1%
Native Hawaiian & Other Pacific Islander: 0%
Other: 7%
Gender
Female: 51%
Male: 49%
Other: 0%