Netspect Technologies Inc
Business Contact
Robert Tan
PresidentBusiness Description
Netspect Technologies Inc is located in Santa Clara, California, and was founded in 2001. At this location, Netspect Technologies Inc employs approximately 2 people. Annual sales for Netspect Technologies Inc are around 130,000.
Employees: 2
Revenue: 130,000
Founded: 2001
Questions & Answers
Q1
How long has Netspect Technologies Inc been in business?
Netspect Technologies Inc has been in business for around 25 years.Q2
What is the phone number for Netspect Technologies Inc?
The phone number for Netspect Technologies Inc is (408) 844-8989.Q3
How big is Netspect Technologies Inc?
Netspect Technologies Inc generates approximately 130,000 in revenue annually, and employs around 2 people at this location.Q4
Where is Netspect Technologies Inc located?
Netspect Technologies Inc is located at 3945 Freedom Circle 360, Santa Clara, California, 95054.Q5
Is there a primary contact for Netspect Technologies Inc?
Robert Tan (President) at Netspect Technologies Inc.Q6
What are the annual sales for Netspect Technologies Inc?
Netspect Technologies Inc has annual sales of approximately 130,000.Q7
How many people are employeed at Netspect Technologies Inc?
Netspect Technologies Inc has around 2 employees at this location.Additional Businesses at this Address
3945 Freedom Circle 360 Santa Clara, California, 95054
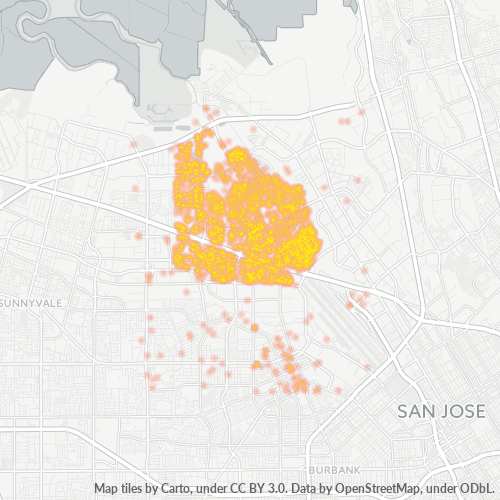
Businesses in Zip Code 95054
Businesses in 95054: 11,942
Population: 22,881
Categories
Shopping: 28%
Professional Services: 24%
Industry: 15%
Other: 34%
Price
Moderate: 53%
Inexpensive: 32%
Expensive: 10%
Very Expensive: 5%
Other: 0%
Area Codes
408: 91%
Other: 9%
Neighborhoods
North San Jose: 65%
Rivermark of Santa Clara: 6%
Santa Clara: 6%
Other: 23%
Stats and Demographics for Zip Code 95054
Race
Asian: 43%
White: 35%
Hispanic or Latino: 13%
Black Or African American: 2%
Native Hawaiian & Other Pacific Islander: 0%
American Indian Or Alaskan Native: 0%
Other: 6%
Gender
Male: 53%
Female: 47%
Other: 0%