New Visions Ccp Cafeteria
Business Contact
Edwin Sherman
OwnerBusiness Description
New Visions Ccp Cafeteria is located in Columbus, Ohio. This business is working in the following industry: Bars, pubs and taverns. Annual sales for New Visions Ccp Cafeteria are around USD 0 - 1,000,000.
Employees: 0-25
Revenue: USD 0 - 1,000,000
Industry
Restaurants » Bars, pubs and taverns
Restaurants » Bars, pubs and taverns
Engaged in:
Bars, pubs and taverns, Restaurants and mobile food service activities
Bars, pubs and taverns, Restaurants and mobile food service activities
ISIC Codes
5610, 5630
NAICS Codes
722410
5610, 5630
NAICS Codes
722410
Questions & Answers
Q1
What is the phone number for New Visions Ccp Cafeteria?
The phone number for New Visions Ccp Cafeteria is (614) 224-0664.Q2
Where is New Visions Ccp Cafeteria located?
New Visions Ccp Cafeteria is located at 330 W Spring St, Ste 110, Columbus, OH 43215-7306.Q3
Is there a primary contact for New Visions Ccp Cafeteria?
Edwin Sherman (Owner) at New Visions Ccp Cafeteria.Q4
Are there other contacts associated with New Visions Ccp Cafeteria?
We have 1 additional contact(s) for New Visions Ccp Cafeteria. They include: Dennis Johnson.Q5
What are the annual sales for New Visions Ccp Cafeteria?
New Visions Ccp Cafeteria has annual sales of approximately USD 0 - 1,000,000.Historical Information
Old business websites and emails that no longer exist, informational purposes only.
www.newvisionsccpcafeteria.com
Similar Companies Nearby
Additional Businesses at this Address
330 W Spring St, Ste 110, Columbus, OH 43215-7306
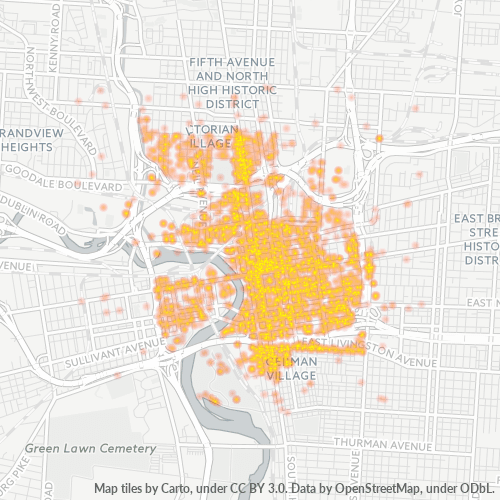
Businesses in Zip Code 43215
Businesses in 43215: 25,413
Population: 14,641
Categories
Professional Services: 30%
Medical: 12%
Other: 57%
Price
Moderate: 50%
Inexpensive: 31%
Expensive: 15%
Very Expensive: 4%
Other: 0%
Area Codes
614: 98%
Other: 2%
Neighborhoods
Arena District: 6%
Downtown: 67%
Other: 27%
Stats and Demographics for Zip Code 43215
Race
White: 70%
Black Or African American: 23%
Hispanic or Latino: 3%
Asian: 2%
American Indian Or Alaskan Native: 0%
Other: 1%
Gender
Male: 56%
Female: 44%
Other: 0%