Paul F Ehinger & Associates
This listing has been marked as closed.
Business Contact
Paul F. Ehinger
OwnerContact Information
Historical Phone: (541) 686-9607
Historical Toll Free: (541) 686-8124
Google Maps: Visit
Edit: Edit or Remove
Business Description
Paul F Ehinger & Associates is located in Eugene, Oregon, and was founded in 1983. At this location, Paul F Ehinger & Associates employs approximately 2 people. Annual sales for Paul F Ehinger & Associates are around USD 150,000.
Employees: 2
Revenue: USD 150,000
Founded: 1983
Filing Number: 678728-88
Industry
Professional Services
Professional Services
Engaged in:
Lawyer
Lawyer
ISIC Codes
6910
NAICS Codes
5411
6910
NAICS Codes
5411
Questions & Answers
Q1
How big is Paul F Ehinger & Associates?
Paul F Ehinger & Associates generates approximately USD 150,000 in revenue annually, and employs around 2 people at this location.Q2
Where is Paul F Ehinger & Associates located?
Paul F Ehinger & Associates is located at 2300 Oakmont Way # 212, Eugene, OR 97401.Q3
What is the web address (URL) for Paul F Ehinger & Associates?
The website for Paul F Ehinger & Associates is www.unitedseating.com.Q4
What are the annual sales for Paul F Ehinger & Associates?
Paul F Ehinger & Associates has annual sales of approximately USD 150,000.Q5
How many people are employeed at Paul F Ehinger & Associates?
Paul F Ehinger & Associates has around 2 employees at this location.Additional Businesses at this Address
2300 Oakmont Way # 212, Eugene, OR 97401
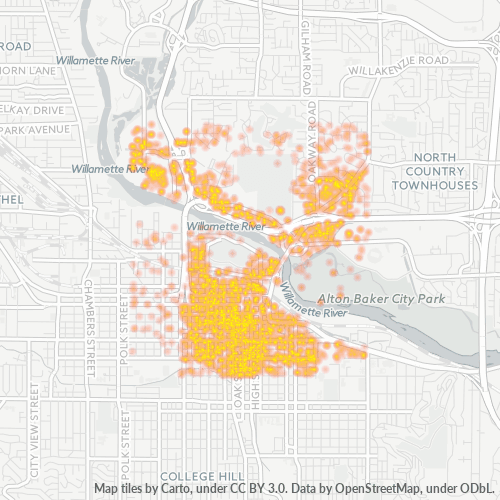
Businesses in Zip Code 97401
Businesses in 97401: 20,525
Population: 41,757
Categories
Medical: 23%
Professional Services: 16%
Shopping: 13%
Other: 48%
Price
Moderate: 55%
Inexpensive: 29%
Expensive: 13%
Very Expensive: 3%
Other: 0%
Area Codes
541: 97%
Other: 3%
Neighborhoods
Cal Young: 23%
Downtown: 30%
Harlow: 9%
Market District: 8%
West Eugene: 16%
Willakenzie: 7%
Other: 7%
Stats and Demographics for Zip Code 97401
Race
White: 86%
Asian: 5%
Hispanic or Latino: 4%
Black Or African American: 1%
American Indian Or Alaskan Native: 1%
Native Hawaiian & Other Pacific Islander: 0%
Other: 2%
Gender
Female: 51%
Male: 49%
Other: 0%