Schiff Hardin & Waite LLP
Business Contact
Paul Wattelet
PresidentEmail: pwattelet@schiffhardin.com
Contact Information
Business Description
Schiff Hardin & Waite LLP is located in Chicago, Illinois, and was founded in 1996. At this location, Schiff Hardin & Waite LLP employs approximately 1000 people. This business is working in the following industry: Computer programming, web design.
Employees: 1000
Founded: 1996
Industry
Professional Services » Computer programming, web design
Professional Services » Computer programming, web design
Engaged in:
Software Consultant, Computer programming activities
Software Consultant, Computer programming activities
ISIC Codes
6201, 6202
SIC Codes
7371
NAICS Codes
541511
6201, 6202
SIC Codes
7371
NAICS Codes
541511
Questions & Answers
Q1
How long has Schiff Hardin & Waite LLP been in business?
Schiff Hardin & Waite LLP has been in business for around 30 years.Q2
What is the phone number for Schiff Hardin & Waite LLP?
The phone number for Schiff Hardin & Waite LLP is (312) 269-2000.Q3
How big is Schiff Hardin & Waite LLP?
Schiff Hardin & Waite LLP employs around 1000 people at this location.Q4
Where is Schiff Hardin & Waite LLP located?
Schiff Hardin & Waite LLP is located at 55 E Monroe St, Chicago, Illinois, 60603.Q5
Is there a primary contact for Schiff Hardin & Waite LLP?
Paul Wattelet (President) at Schiff Hardin & Waite LLP. You can contact Paul Wattelet at email address pwattelet@schiffhardin.com.Q6
How many people are employeed at Schiff Hardin & Waite LLP?
Schiff Hardin & Waite LLP has around 1000 employees at this location.Similar Companies Nearby
Additional Businesses at this Address
55 E Monroe St Chicago, Illinois, 60603
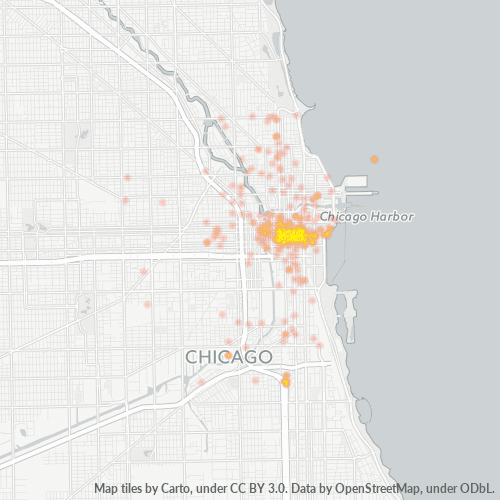
Businesses in Zip Code 60603
Businesses in 60603: 12,908
Population: 448
Categories
Professional Services: 50%
Shopping: 12%
Financial Services: 10%
Other: 28%
Price
Moderate: 53%
Expensive: 21%
Inexpensive: 21%
Very Expensive: 5%
Other: 0%
Area Codes
312: 94%
Other: 6%
Neighborhoods
Chicago Loop: 92%
Other: 8%
Stats and Demographics for Zip Code 60603
Race
White: 71%
Asian: 18%
Hispanic or Latino: 7%
Black Or African American: 2%
Native Hawaiian & Other Pacific Islander: 1%
American Indian Or Alaskan Native: 0%
Other: 1%
Gender
Female: 54%
Male: 46%
Other: 0%