Shin Maria K DDS
Contact Information
Business Description
Shin Maria K DDS is located in Closter, New Jersey, and was founded in 2018. At this location, Shin Maria K DDS employs approximately 4 people. This business is working in the following industry: Dentists. Annual sales for Shin Maria K DDS are around 61,514.
Employees: 4
Revenue: 61,514
Founded: 2018
Industry
Medical » Dentists
Medical » Dentists
Engaged in:
Dentists
Dentists
ISIC Codes
8620
NAICS Codes
621210
8620
NAICS Codes
621210
Questions & Answers
Q1
How long has Shin Maria K DDS been in business?
Shin Maria K DDS has been in business for around 9 years.Q2
What is the phone number for Shin Maria K DDS?
The phone number for Shin Maria K DDS is (201) 784-3200.Q3
How big is Shin Maria K DDS?
Shin Maria K DDS generates approximately 61,514 in revenue annually, and employs around 4 people at this location.Q4
Where is Shin Maria K DDS located?
Shin Maria K DDS is located at 500 Piermont Rd # 204, Closter, NJ 07624.Q5
Is there a primary contact for Shin Maria K DDS?
You can contact Shin Maria K DDS by phone using number (201) 784-3200.Q6
What are the annual sales for Shin Maria K DDS?
Shin Maria K DDS has annual sales of approximately 61,514.Q7
How many people are employeed at Shin Maria K DDS?
Shin Maria K DDS has around 4 employees at this location.Historical Information
Old business websites and emails that no longer exist, informational purposes only.
www.abcpediatricdentalcare.net
Additional Businesses at this Address
500 Piermont Rd # 204, Closter, NJ 07624
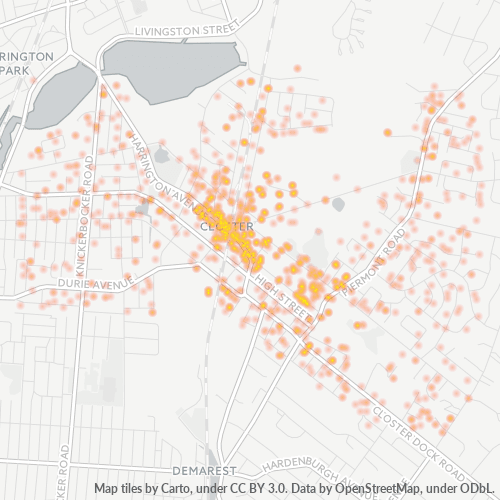
Businesses in Zip Code 07624
Businesses in 07624: 2,608
Population: 8,025
Categories
Shopping: 18%
Professional Services: 12%
Medical: 10%
Home Services: 10%
Other: 50%
Price
Moderate: 53%
Inexpensive: 31%
Expensive: 13%
Very Expensive: 3%
Other: 0%
Area Codes
201: 98%
Other: 2%
Stats and Demographics for Zip Code 07624
Race
White: 74%
Asian: 21%
Hispanic or Latino: 4%
Black Or African American: 1%
American Indian Or Alaskan Native: 0%
Other: 1%
Gender
Female: 51%
Male: 49%
Other: 0%