Sono Investments LLC
Business Contact
David Rainer
PrincipalBusiness Description
Sono Investments LLC is located in Stratford, Connecticut, and was founded in 2010. At this location, Sono Investments LLC employs approximately 2 people. Annual sales for Sono Investments LLC are around USD 140,000.
Employees: 2
Revenue: USD 140,000
Founded: 2010
Filing Number: 0889829
Questions & Answers
Q1
How long has Sono Investments LLC been in business?
Sono Investments LLC has been in business for around 16 years.Q2
How big is Sono Investments LLC?
Sono Investments LLC generates approximately USD 140,000 in revenue annually, and employs around 2 people at this location.Q3
Where is Sono Investments LLC located?
Sono Investments LLC is located at 140 Watson Blvd, Stratford, Connecticut, 06615-7127.Q4
Is there a primary contact for Sono Investments LLC?
David Rainer (Principal) at Sono Investments LLC.Q5
Are there other contacts associated with Sono Investments LLC?
We have 1 additional contact(s) for Sono Investments LLC. They include: Mary Jo Rainer.Q6
What are the annual sales for Sono Investments LLC?
Sono Investments LLC has annual sales of approximately USD 140,000.Q7
How many people are employeed at Sono Investments LLC?
Sono Investments LLC has around 2 employees at this location.Additional Businesses at this Address
140 Watson Blvd Stratford, Connecticut, 06615-7127
Stratford Racquetball Club
Business at this address
Business at this address
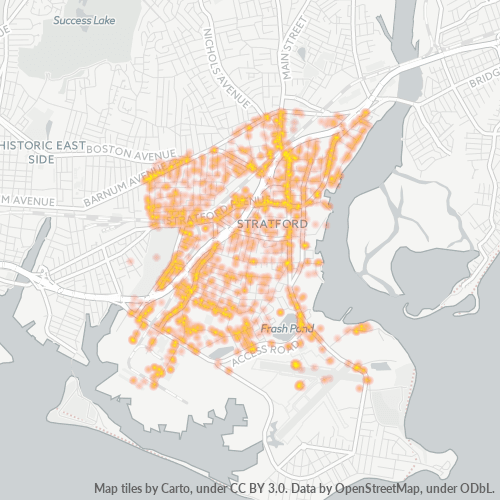
Businesses in Zip Code 06615
Businesses in 06615: 4,074
Population: 18,493
Categories
Shopping: 16%
Industry: 13%
Professional Services: 13%
Home Services: 10%
Other: 48%
Price
Moderate: 48%
Inexpensive: 44%
Expensive: 7%
Very Expensive: 1%
Other: 0%
Area Codes
203: 98%
Other: 2%
Neighborhoods
Brooklawn - St. Vincent: 15%
South End: 18%
Stratford: 17%
Stratford Center Historic District: 19%
Other: 30%
Stats and Demographics for Zip Code 06615
Race
White: 65%
Black Or African American: 20%
Hispanic or Latino: 10%
Asian: 1%
American Indian Or Alaskan Native: 0%
Other: 3%
Gender
Female: 52%
Male: 48%
Other: 0%