Secure Benefits Group
Business Contact
Robert Sage
PresidentContact Information
Business Description
Secure Benefits Group is located in Eugene, Oregon, and was founded in 1999. This business is working in the following industry: Financial services. Annual sales for Secure Benefits Group are around 100,000.
Revenue: 100,000
Founded: 1999
Industry
Financial Services » Financial services
Financial Services » Financial services
Engaged in:
Activities of insurance agents and brokers
Activities of insurance agents and brokers
ISIC Codes
6622
SIC Codes
6411
NAICS Codes
524210
6622
SIC Codes
6411
NAICS Codes
524210
Questions & Answers
Q1
How long has Secure Benefits Group been in business?
Secure Benefits Group has been in business for around 28 years.Q2
What is the phone number for Secure Benefits Group?
The phone number for Secure Benefits Group is (541) 338-3133.Q3
Where is Secure Benefits Group located?
Secure Benefits Group is located at 2300 Oakmont Way, Eugene, Oregon, 97401-5521.Q4
Is there a primary contact for Secure Benefits Group?
Robert Sage (President) at Secure Benefits Group.Q5
Are there other contacts associated with Secure Benefits Group?
We have 3 additional contact(s) for Secure Benefits Group. They include: Kerri E. Sage, Rohn M. Roberts & Groshong Gordon.Q6
What are the annual sales for Secure Benefits Group?
Secure Benefits Group has annual sales of approximately 100,000.Similar Companies Nearby
Additional Businesses at this Address
2300 Oakmont Way Eugene, Oregon, 97401-5521
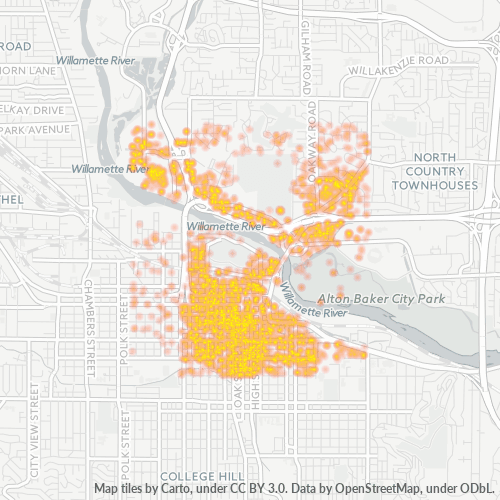
Businesses in Zip Code 97401
Businesses in 97401: 20,525
Population: 41,757
Categories
Medical: 23%
Professional Services: 16%
Shopping: 13%
Other: 48%
Price
Moderate: 55%
Inexpensive: 29%
Expensive: 13%
Very Expensive: 3%
Other: 0%
Area Codes
541: 97%
Other: 3%
Neighborhoods
Cal Young: 23%
Downtown: 30%
Harlow: 9%
Market District: 8%
West Eugene: 16%
Willakenzie: 7%
Other: 7%
Stats and Demographics for Zip Code 97401
Race
White: 86%
Asian: 5%
Hispanic or Latino: 4%
Black Or African American: 1%
American Indian Or Alaskan Native: 1%
Native Hawaiian & Other Pacific Islander: 0%
Other: 2%
Gender
Female: 51%
Male: 49%
Other: 0%